
2022 Updates and
Seasonal Outlook for NS_ June 10
2022 Degree Day
Accumulations and Crop Update
Table 1.0 Degree day accumulations as of June 6, 2022. All data are taken from the Kentville weather station, based on a start date of March 1, and calculated using the single sine method.
|
Category |
2019 |
2020 |
2021 |
2022 |
5
year average |
10
year average |
|
Plant
development (Base 5ºC) |
277.5 |
313.6 |
416.4 |
383.1 |
342.9 |
360.2 |
|
Insect
development (Base 10º) |
86.7 |
137.8 |
184.4 |
160.8 |
141.3 |
155.4 |
Here is a summary of 2022-degree day accumulations from the Kentville weather station. This summary gives us an idea of where we are at in terms of this season’s growth and development. In NS, we are above both 5-year and 10-year averages (383.1 GDD vs 342.9 GDD and 360.2 GDD).
Here is another GDD accumulations update from wild
blueberry weather stations:
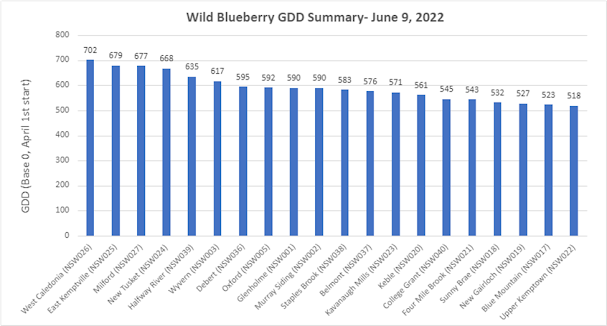
Figure
1. Wild Blueberry GDD Summary- June 9, 2022
The average of GDD accumulations from all stations was
591. As we have many different growing regions with different development stages
in the province, it is hard and unrealistic to give a solid statement about the
whole province’s crop development. However, in general, we are looking at more
than 50% to 90% plant emergence in sprout fields in NS. In fruit fields, we are
at 90% open flowers, with some early to middle fields getting to more than 50% petal
fall (pin head). Even late fields, such as Advocate and Cape Breton Island, fields
are in the early to middle flowering stages.
As I mentioned in the last update, we observed low diseases
infection for this season due to the dryness of the weather.
Weed Management
in Sprout Fields and Use of Callisto 480 SC (mesotrione)
During this time of the year, activities can be and
should be done in sprout fields including weed management. Growers can pull or
cut weeds above the blueberry canopy before they go to seed or cut weeds to the
base. If it is necessary, some selective post-emergent herbicides, such as Callisto
480 SC (mesotrione) can be used to control a wide range of broadleaf weeds.
Here is a little bit of information about using
Callisto to achieve effective weed management.
Blueberry growers have observed more crop injury when
applications are made under hot and/or humid conditions or when the crop is
stressed from flooding. The injury is most visible where excessive rates have
been applied, such as sprayer overlaps. If heavy rain is expected within 48
hours, an application should be delayed. For improved crop safety, make
applications under cooler conditions (early morning or evening) or when daytime
temperatures are below 21 °C.
Pollination and
Determining Percent Fruit Set in Wild BLueebrry Fields
In general, genetic factors of wild blueberry plants
play a critical part in affecting pollination, other factors also contribute to
and influence the overall pollination rate. Those factors include weather,
plant vigour, distribution of clones and the population of pollinating insects.
Because there are so many factors to affect pollination, it is not realistic to
achieve a high % fruit set of 75 to 100%.
In general, pollination rates of 40 to 50% are considered
very good, while 50 to 60% would be considered excellent. If the rate is below
30%, this shows the pollination force is too low.
Growers will get the benefits to understand and know
how to determine the % fruit set. When growers know their % fruit set, they
will be in a better position to understand their field and productivity, as
well as help them to improve their production practices.
There is a great factsheet from the Department of
Agriculture in NB that talks about determining % the fruit set in wild
blueberry fields. Here is the link to this factsheet, but you can read the information
below to get quick access to this information. https://www2.gnb.ca/content/gnb/en/departments/10/agriculture/content/crops/wild_blueberries/determining_percent_fruit_set.html
Information from the
factsheet:
When you sample a field, you
should sample ALL the field. Since conditions may vary from field edges to
field centres, you will need to sample both types of areas unless you are
trying to compare them. If you sample a big area, then you will need to take
more samples. Fifty to one hundred samples seem to be adequate for a twenty
acre field.
Walking your field during early to mid-bloom,
you will take RANDOM samples by crossing the field back and forth in the shape
of a "W", as you would for soil sampling. At each one of the sites at
which you stop, you should sample in the following fashion:
- You will be following the
progress of one stem at each sample site. At each site, drop a pen or a
similar small object and sample the stem which is located closest to where
the object falls. This will keep your sampling random. You can identify
the stem by tying a piece of coloured synthetic string loosely to the
stem, below the flower stalk (known botanically as a raceme). Place a
brightly colored flag right next to it, so that you can locate the general
location of your sample stem. Identify the sample number with indelible
ink on the flag, and record this number and the information described
below in a log book.
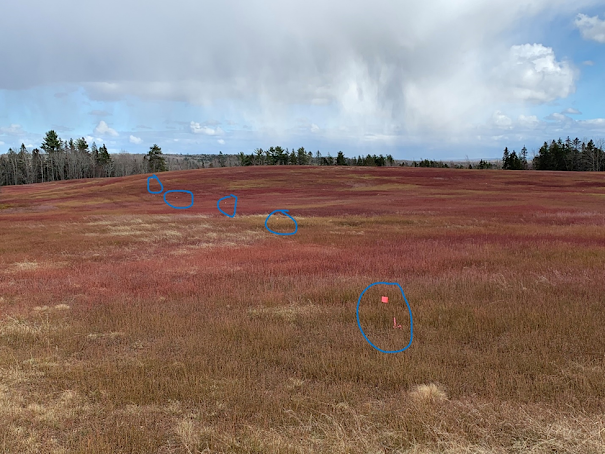
Figure 2. An example of tagging and flagging
study stems
When
sampling at early to mid-bloom, you would be counting and recording the TOTAL
NUMBER OF FLOWER STRUCTURES which are found on the sample stem (this
includes unopened blossoms, open blossoms, and blossoms which have lost their
petals).
- Prior to harvest just when most
of the fruits have turned blue, return to the same sample and count
the TOTAL NUMBER OF BERRIES which will produce a
harvestable fruit. Do not include the "pinheads" (those fruits
which have larger crowns than berries).
- Use the information from (1)
and (2) to determine the percent fruit set for the sample site, and then
combine the information to learn the average percent fruit set for the
field.
Here is an example:
- From section 1. The TOTAL
NUMBER OF FLOWERS e.g., 70 unopened buds, open
flowers, flowers without petals
- From Section 2. The TOTAL
NUMBER OF BERRIES e.g., 35 harvestable berries
- PERCENT FRUIT SET = (35 / 70) x 100 = 50%
To calculate the percent fruit set for the
field, add all the sampling sites and divide by the number of sites. If the
differences between the sampling sites are very big, you might consider taking
more samples next year OR you might try and figure out why. Some growers claim
to get up to 70% fruit set; so if your figures are really low, you know that
the top priority for managing that field is bees.
You can also use this method to calculate
differences between your fields or differences that you might have from using
or not using hives.
I will issue June’s Perennia Wild Blueberry
Newsletter (BlueFocus) early next week. Stay tuned for the issue. We have some
updates to share!
Have a great weekend!
Hugh